
🎓 Definition
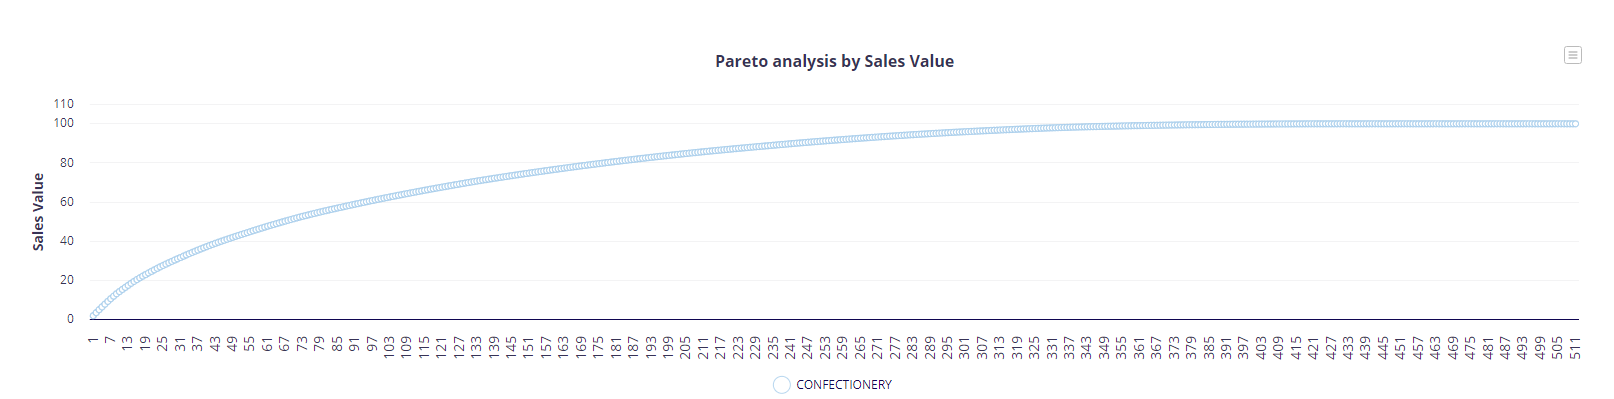
In a product range, each SKU contributes to a percentage of the total sales. Calculating the sales contribution of each SKU and sorting them from largest to smallest, and adding up the sales contribution of each SKU will provide the Pareto of Assortment effectiveness. This reveals that a few SKUs typically account for the majority of sales, following the well-known 80/20 rule.
The less there are SKUs with minimal sales contribution, the more the Assortment is effective. As shelf space is limited, Retailers often tend to remove low-performing SKUs, and in such cases, Manufactures should review their retail mix to avoid a potential delisting.
🧪 Example of Assortment Effectiveness
Considering the Pareto Principle, assuming in the Dairy category assortment ranges go up to 200 SKUs, and on average could generate $25,000 in sales per month. However, only 35 SKUs are responsible for $20,000 or 80% of sales, while the remaining 165 SKUs could only generate the rest 20% of sales.
💡Tips
Any of the SKUs that are over 80% of sales is called the ‘tail’ of the Pareto. Anything that is in the tail, unless it performs a unique role or is of high value, is subject to rationalization – particularly if it:
- Duplicate the functionality of a product in the top 80%.
- Deliver a low margin.
- Have a low stock turn.
The 80/20 method of range rationalization looks at individual SKU contributions but doesn’t look at coverage or unique needs. So, in doing an Assortment effectiveness analysis, one needs to keep in mind the following:
- Category coverage: Does the Top 80% of SKUs cover most or all of the needs of the category?
- Segment coverage: Do the Top 80% of SKUs represent products from each Segment of the category? Or are there products in the tail that fulfill this function?
- Unique skus: Are any of the products in the tail a unique SKU that fulfills a special need and therefore can’t be deleted?
- New products: Are any of the products in the tail newly introduced (ie in the past 6 months)?
📅 Frequency
Based on our experience assortment effectiveness analysis needs to be done quarterly or twice a year to track the progress of new products listed and their potential entry into the Top 80% or should be delisted in case of poor performances or need to be activated.
❓What is used for
- By identifying the products that contribute the most to sales, Retailers can adjust their inventory levels accordingly. They can ensure that high-performing products are always in stock while reducing the inventory levels of low-performing products.
- Pareto chart can be used to evaluate the performance of different product categories and identify areas for improvement. This information can help adjust Retailer's category strategy and focus on high-performing categories.
- Pareto charts can help to select products that are suitable for a promotion that drives sales and customer engagement.
- Retailers can share the Pareto chart with their Manufacturers to help them understand which products are the most important to their business.
How is the Assortment Effectiveness analysis conducted in terms of data collection and methodology?
Assortment Effectiveness analysis involves collecting sales data for each Stock Keeping Unit (SKU) within a product range. The sales contribution of each SKU is calculated, sorted from largest to smallest, and then added up to determine the Pareto of Assortment effectiveness. This analysis typically uses sales data, inventory levels, and SKU performance metrics. Retailers and Manufacturers might utilize various tools and software to streamline this process, such as inventory management systems, sales analytics platforms, and Pareto chart generators. Data sources can include point-of-sale systems, inventory databases, and sales reports.
What are the potential consequences for Manufacturers if their products are delisted due to poor assortment effectiveness?
If a Manufacturer's products are delisted due to poor assortment effectiveness, it can have significant implications for their business. Delisting can negatively impact the Manufacturer's sales performance, market visibility, and brand reputation. Moreover, it can strain the relationship between the Manufacturer and Retailer, potentially leading to decreased collaboration and support from Retailers in the future. Manufacturers may also face challenges in finding alternative distribution channels and reaching their target customers effectively. Therefore, it is crucial for Manufacturers to proactively review their retail mix, optimize SKU performance, and collaborate closely with Retailers to avoid delisting and maintain a strong market presence.
How can Manufacturers and Retailers collaborate to optimize assortment effectiveness?
Manufacturers and Retailers can collaborate effectively to optimize assortment effectiveness by adopting a data-driven approach and implementing collaborative strategies. Manufacturers should regularly review their product portfolio, analyze SKU performance, and identify opportunities for improvement. They can work closely with Retailers to understand their category strategy, customer needs, and inventory requirements. By sharing sales data, market insights, and feedback, Manufacturers can help Retailers make informed decisions and adjust their inventory levels accordingly. Additionally, Manufacturers can collaborate with Retailers on product promotions, new product launches, and category management initiatives to drive sales, enhance customer engagement, and optimize assortment effectiveness. This collaborative approach fosters mutual understanding, trust, and partnership between Manufacturers and Retailers, leading to improved business performance and customer satisfaction.
🖥️ Make it happen in Ariane
How to access Assortment Effectiveness in Ariane
Step 1: Select the Pareto Menu in the Range Menu Bar.

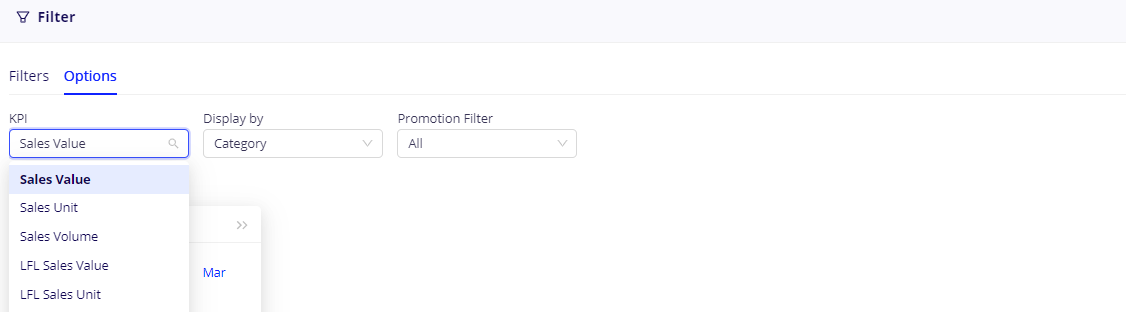
Step 2: Select Option in the Filter Menu and choose the KPI, hierarchy level and Promotion filter you want to measure.
Step 3: Select the period you want to measure.

And here it is.


• Brand Effectiveness
• Assortment Rationalization
• Market share - Sales contribution