
🎓Definition
A cohort is a group of people with similar behaviors or characteristics within a certain period of time. Cohort analysis is a type of behavioral analytics, which is primarily identified by breaking down customers into related groups in order to gain a better understanding of their behaviors.
🧪 Example of Cohort analysis
Behavioral Cohorts: Loyal Customers are divided based on their purchasing behaviors for a specific category and for a specific channel.
The analysis can be measured through the:
- Frequency - The time Customer comes to shop in a selected period scope.
For example:
Customers who come to shop 1 time per month vs.
Customers who come to shop up to 5 or more times per month.
- Basket Tier - Average Value spent per basket/transaction within a selected Category by tiers from Most to least in the selected period scope.
For example: Customer's Average Spending per Basket varied from 10$ - 100$ in November 2022
Customers who spend 81$ - 100$ per in Tier 5
Customers who spend 61$ - 80$ per in Tier 4
Customers who spend 41$ - 60$ per in Tier 3
Customers who spend 21$ - 40$ per in Tier 2
Customers who spend 1$ - 20$ per in Tier 1
- ABC Segment - Spending Contribution groups who spend from the biggest value to the lowest value per trip (similar to Pareto).
For example:
Segment A: Customers who spend the biggest value contribution per trip.
Segment B: Customers who spend the Top 2nd value contribution per trip.
Segment C: Customers who spend the Top 3rd value contribution per trip.
Segment D: Customers who spend the 4th value contribution per trip.
Segment E: Customers who spend the lowest value contribution per trip.
- RM Segment - 2 Criteria combination of the Analysis
: Recency - How recent Customers come to shop.
: Monetary - How much Customers spend per trip.
For example:
Recency >= 80% (on rank) AND Spending >= 80% (on rank) =>> "CHAMPIONS"
Recency < 80% (on rank) AND Spending >= 80% (on rank) =>> "LOYAL"
Recency >= 80% (on rank) AND Spending < 80% (on rank) =>> "POTENTIAL"
Recency < 80% (on rank) AND Spending < 80% (on rank) =>> "AT RISK / CHURN"
❓What is used for
Customer cohort analysis is particularly useful when one wants to better understand a certain group of individuals. Let's say you want to better understand Pet Food Buyers. The cohort analysis will share insights about their shopping frequency, the value of their spending (inside the pet food category and across the whole store as well), the profitability they contribute to, etc... Analyzing these trends within cohort will help you progressively fine tune the quality of your commercial offering to this specific population.
A cohort analysis will also be very relevant when used with a cross merchandising analysis: what are the next bets purchases for this population, depending on their shopping behaviors.
In comparing different user groups, the Marketing Team can identify Customer segmentation through their buying trends and patterns, and identify which behavioral changes, either Recency, Frequency, or Spending can cause different results.
Cohort Analysis is a useful practice for reducing early Customer Churn. Cohort Analysis charts will indicate the period of time after which customers churn. If churn occurs within the first few weeks, the typical reasons may be: the product is not meeting customers’ expectations; poor onboarding processes; and/or a poor user acquisition model. So, the right actions can be implemented to better target their messaging to engage Customers closer, alter their services, meet customers’ needs, and improve Sales and profits.
Benefits Summary
- To identify what type of Customers should be prioritized
- To plan the Targeted Campaign based on different Customer Behavior
- To make better product decisions and improve product retention rate
- To visualize Customer Behaviors in terms of Traffic and Spending in a Business Unit
- To increase product revenue
- To track, understand and reduce Churn Rate
- To increase Customers Retention Rate
- To be able to predict future Customer consumption.
How do you effectively implement cohort analysis in a business setting?
Implementing cohort analysis effectively in a business setting involves several key steps. First, you need to identify the right cohorts based on your business goals and customer segments. This requires collecting and organizing relevant data, such as customer purchase history, frequency of interactions, and spending patterns. Utilizing analytics tools and software can help streamline this process and provide actionable insights.
Once the cohorts are defined, it's essential to conduct a thorough analysis to understand customer behaviors and trends within each group. This includes measuring metrics like frequency of purchase, average transaction value, and customer retention rates over time. Visualization tools can be valuable here to present the data in an easily understandable format.
Lastly, businesses should use the insights gained from cohort analysis to inform their marketing strategies, product development, and customer engagement initiatives. Regularly reviewing and updating the cohorts based on new data and changing customer behaviors is also crucial for maintaining the effectiveness of cohort analysis over time.
What are the potential challenges or limitations of using cohort analysis?
While cohort analysis can provide valuable insights into customer behaviors and preferences, it's not without its challenges and limitations. One potential challenge is ensuring the accuracy and reliability of the data used for analysis. Inaccurate or incomplete data can lead to misleading conclusions and ineffective strategies.
Another limitation is the complexity of analyzing multiple cohorts simultaneously, especially for businesses with diverse customer segments and product categories. Managing and interpreting large volumes of data can be time-consuming and require specialized skills and resources.
Additionally, cohort analysis focuses on historical data, which may not always accurately predict future customer behaviors or market trends. External factors such as economic conditions, competitive landscape, and technological advancements can also impact customer behaviors and complicate the analysis.
How can businesses integrate cohort analysis with other analytics or strategies for more comprehensive insights?
Integrating cohort analysis with other analytics or strategies can provide businesses with more comprehensive insights into customer behaviors and preferences. One approach is to combine cohort analysis with cross-merchandising analysis to identify potential upsell or cross-sell opportunities based on customer shopping behaviors and preferences.
Businesses can also integrate cohort analysis with segmentation analysis to further refine and target their marketing campaigns and customer engagement initiatives. This involves categorizing customers into different segments based on shared characteristics or behaviors and then analyzing each segment's performance and response to various marketing strategies.
Additionally, integrating cohort analysis with predictive analytics can help businesses forecast future customer behaviors and market trends more accurately. By leveraging advanced analytics and machine learning algorithms, businesses can identify patterns and trends in the data that may not be immediately apparent through cohort analysis alone, allowing them to make more informed decisions and strategies for driving growth and profitability.
💻Cohort analysis in Ulys Customer Intelligence
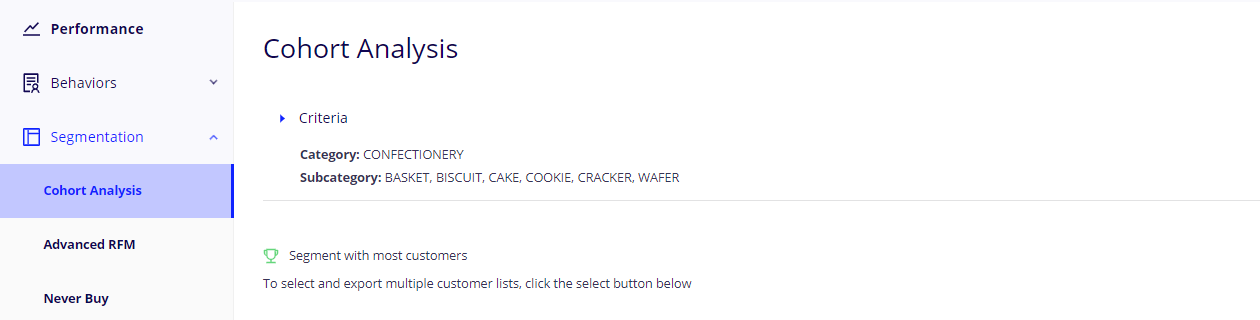
How to access Cohort analysis in Ulys: 2 Simple Steps
Step 1: Select Cohort Analysis Menu from Segmentation Menu Bar.
Step 2: Select the KPI and period at which you want to measure the type of behavior.
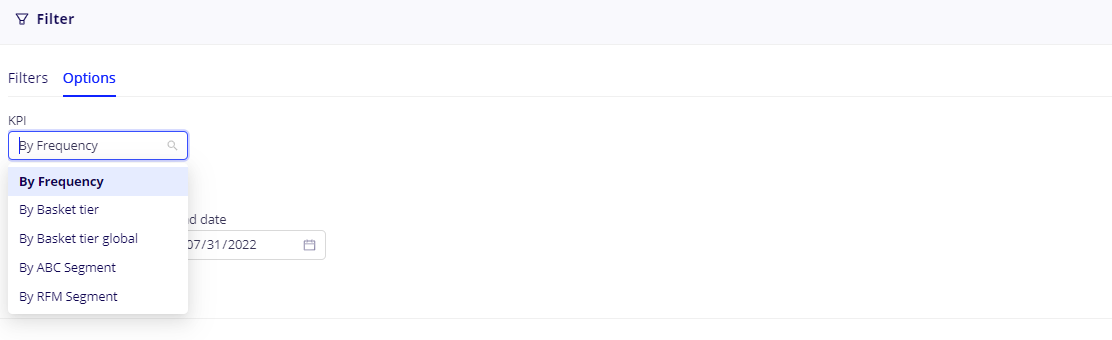
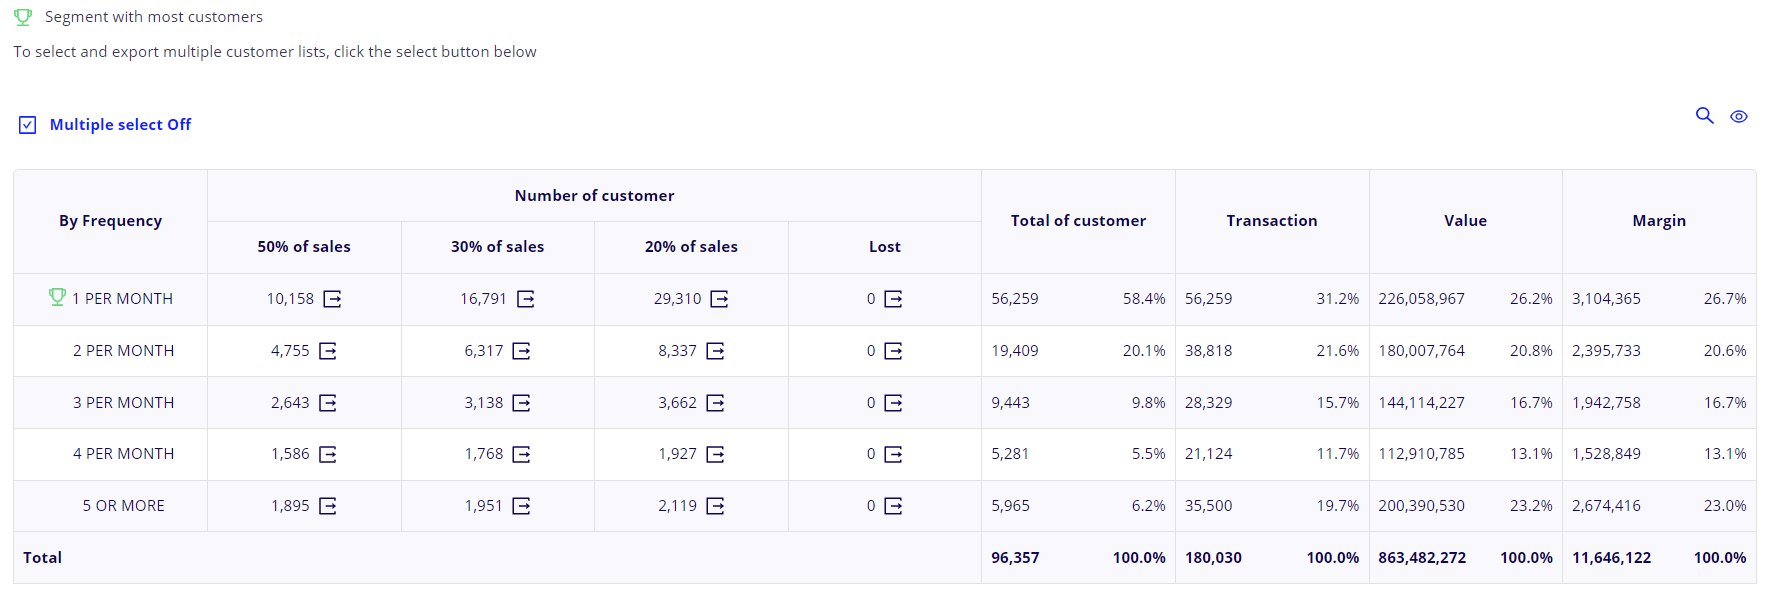
And here it is. Classification of customer groups can vary depending on the selected KPIs.
And form any segment, a campaign can be automatically generated, building the product offer and sales forecasts on the behaviors of that selected population.
• ABC Analysis
• RFM Analysis
• Churn Rate
• New Customer Onboarding Journey
• Targeted Offer